The American credit landscape has undergone a remarkable transformation over the past decade and a half.
As of September 2024, the average FICO® Score in the United States stands at 715, representing a 26-point increase since 2010 and marking a period of sustained credit health improvement across the nation.
Starting from a post-recession low of 689 in 2010-2011, the national average has climbed steadily, with particularly notable acceleration during the 2019-2021 period.
This 12-point jump during the pandemic years—from 703 in 2019 to 715 by 2023—represents one of the most significant short-term improvements in credit health in recent history.
Several factors have contributed to this upward trend.
- The pandemic-era stimulus payments (source)
- Enhanced unemployment benefits (source)
- Temporary forbearance programs on mortgages and student loans
All these factors have provided Americans with unprecedented financial breathing room.
Many consumers used this opportunity to pay down credit card debt and avoid missed payments, directly improving their credit profiles. Additionally, reduced spending during lockdowns allowed many households to strengthen their financial positions.
The stabilization at 715 for both 2023 and 2024 suggests we may have reached a new equilibrium point. This plateau could indicate that the extraordinary circumstances that drove rapid improvement have normalized, and we’re now seeing credit scores settle at a sustainably higher level than pre-pandemic norms.
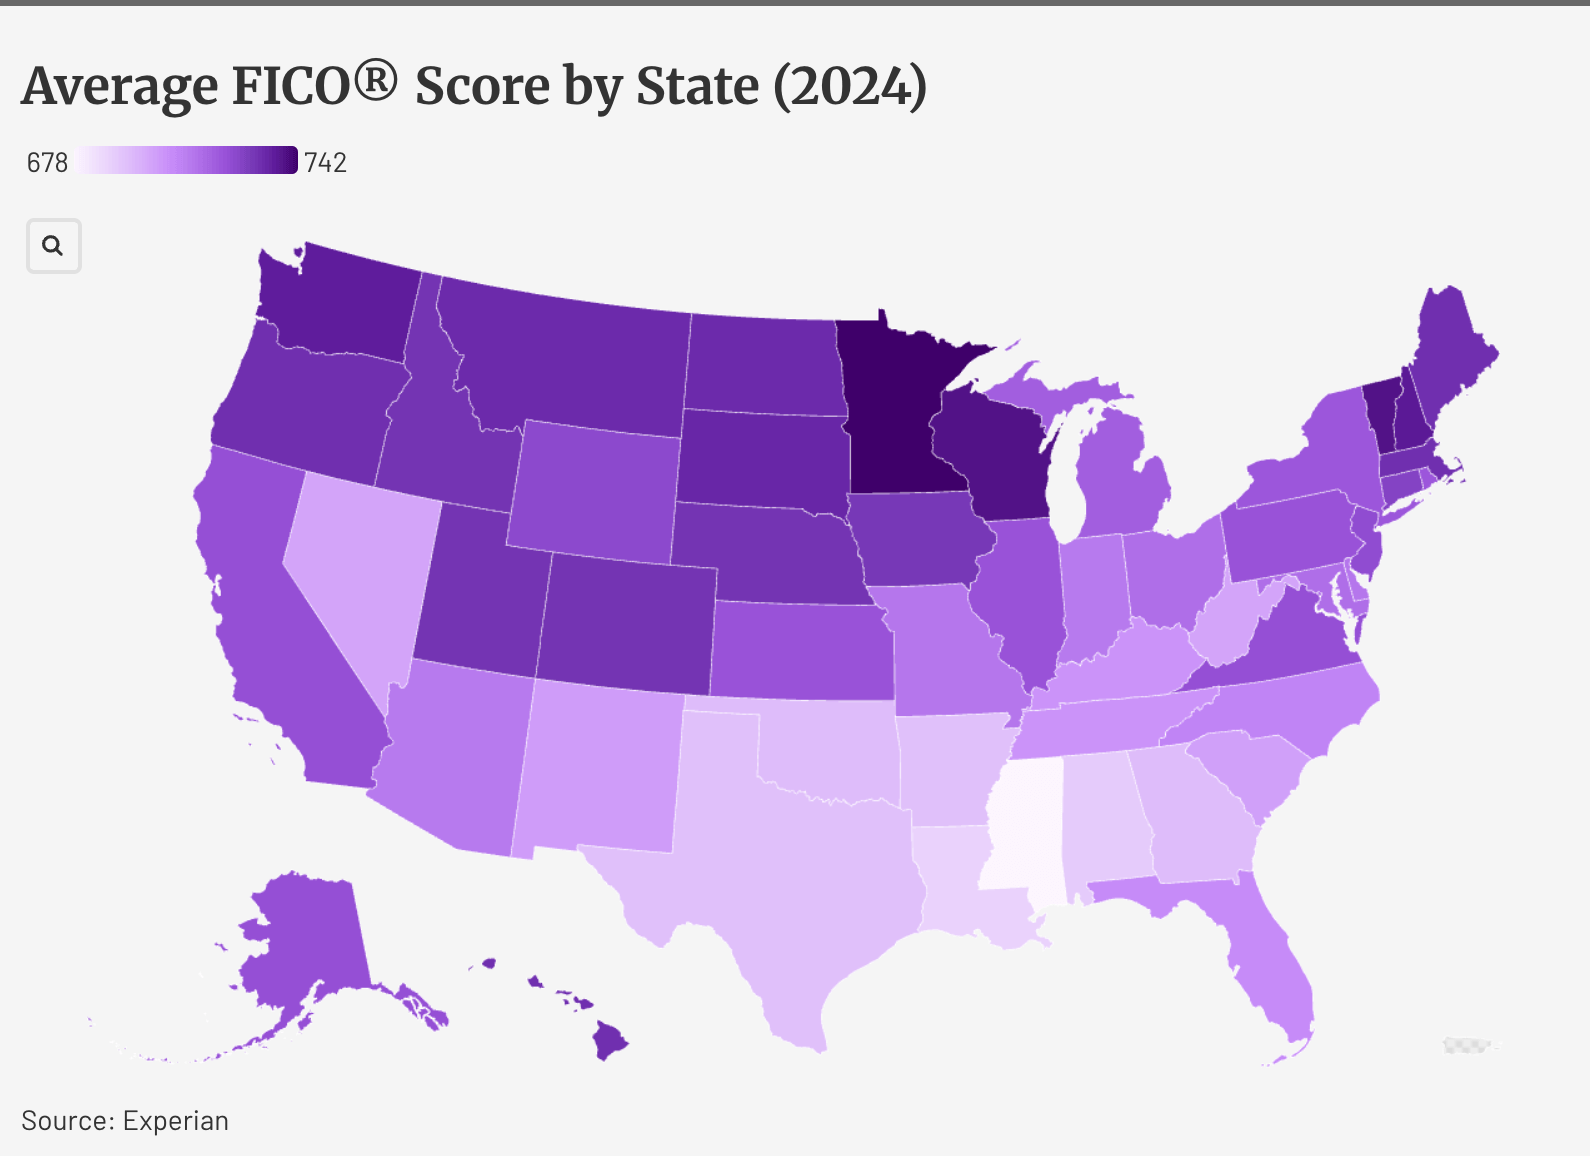
Average FICO® Scores by State
The 2025 state-by-state data reveals a striking 64-point gap between the highest and lowest average FICO Scores across the nation. Minnesota leads with an impressive 742, while Mississippi trails at 678
This is an interactive map. Tap or hover to reveal more information.
The states with the highest scores— Minnesota (742), Vermont (738), Wisconsin (738), New Hampshire (736), Washington (735), and North Dakota (732)—share several common characteristics that contribute to their superior credit profiles:
Economic Stability: These states generally feature diversified economies (according to the Hachman Index) with relatively low unemployment rates and stable job markets.
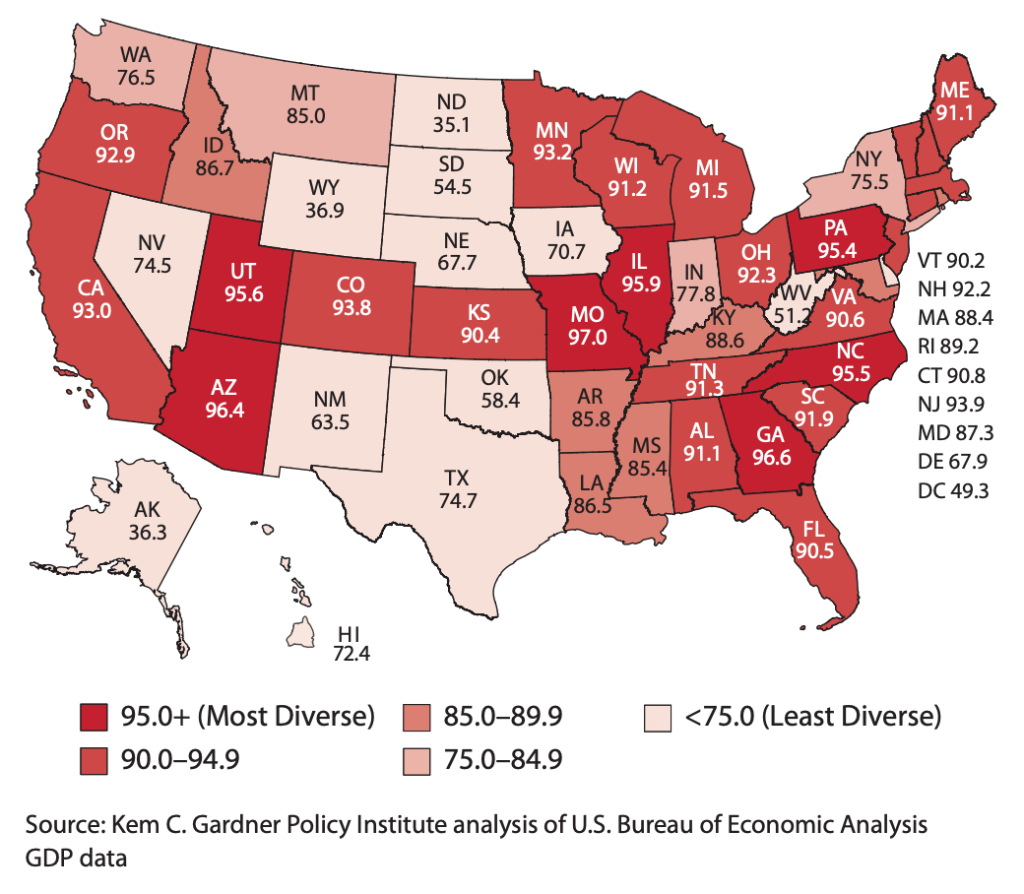
Minnesota’s diverse economy, spanning healthcare, technology, and agriculture, provides residents with consistent income opportunities that support regular debt payments.
Educational Attainment: Higher education levels correlate strongly with financial literacy and better credit management.
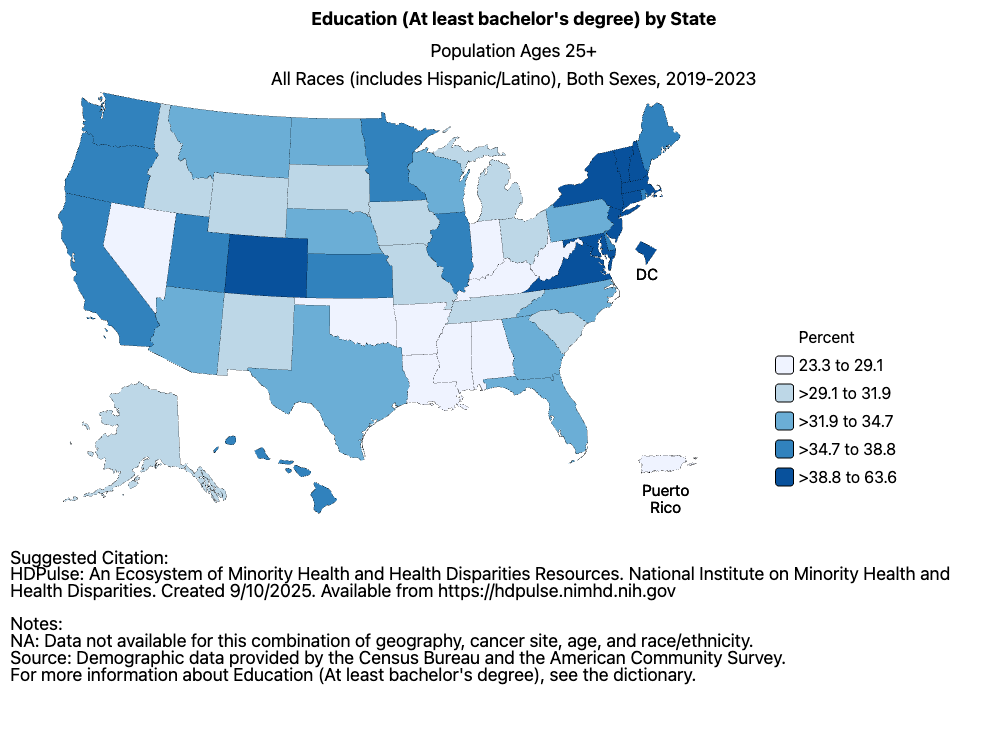
States like Vermont and New Hampshire consistently rank among the most educated in the nation, suggesting their residents may be better equipped to understand and navigate credit systems effectively.
Cultural Factors: The Upper Midwest and Northern New England regions have historically emphasized fiscal conservatism and financial prudence.
At the other end of the spectrum, states like Mississippi (678), Louisiana (688), Alabama (690), and Arkansas (693) face persistent credit score challenges that reflect broader economic difficulties:
Income Inequality: These states often exhibit higher levels of income inequality and poverty, making it more difficult for large segments of the population to maintain stable credit profiles.
When a significant portion of income goes to basic necessities, there’s less buffer for financial emergencies that can trigger missed payments.
Historical Factors: The legacy of historical economic disadvantages, including limited access to traditional banking services and predatory lending practices, continues to impact credit scores in these regions.
Generations of families without strong credit histories face additional challenges in building positive credit profiles.
Educational Gaps: Lower average educational attainment in these states correlates with reduced financial literacy, potentially leading to suboptimal credit decisions and difficulty recovering from financial setbacks.
Economic Volatility: Many lower-scoring states have economies heavily dependent on single industries (like energy in Louisiana or agriculture in Mississippi), making them more vulnerable to economic shocks that can cascade into credit problems for residents.
Analyzing Change Patterns from 2019-2024
The map below showing changes in average FICO Scores from 2019 to 2024 reveals that credit improvement has been nearly universal but far from uniform.
Every state shows improvement, but the magnitude varies significantly, with some states gaining over 20 points while others improved by less than 5 points.
This is an interactive map. Tap or hover to reveal more information.
States showing the darkest blue on the change map—indicating improvements of 15-20+ points—likely benefited from a combination of factors:
Pandemic Relief Effectiveness: States where federal pandemic relief had the most significant impact on household finances saw larger score improvements.
Economic Recovery Patterns: States with robust post-pandemic economic recoveries, particularly those with strong job growth in high-paying sectors, enabled residents to strengthen their credit profiles more dramatically.
Policy Interventions: Some states implemented additional consumer protection measures or financial assistance programs that complemented federal efforts, amplifying the positive impact on credit scores.
States showing lighter improvements (0-8 points) may have already had relatively high scores in 2019, leaving less room for dramatic improvement.
Alternatively, these states might have faced persistent economic challenges that limited the beneficial impact of pandemic-era programs.
As we continue through 2025 and beyond, the challenge will be maintaining the gains achieved while addressing the structural inequalities that leave some states and communities behind.
The data tells us where we are, but it’s up to lenders, policymakers, and consumers themselves to determine where we go from here.
Leave a Reply