The average Credit card debt in America looks very different depending on where you are, with clear regional patterns that tie into broader trends in household debt, income, and the ages of the people carrying it.
According to the Federal Reserve Bank of New York’s Q2 2025 Household Debt and Credit Report, total household debt balances have reached unprecedented levels at $18.39 trillion, representing a $4.24 trillion increase since the end of 2019.
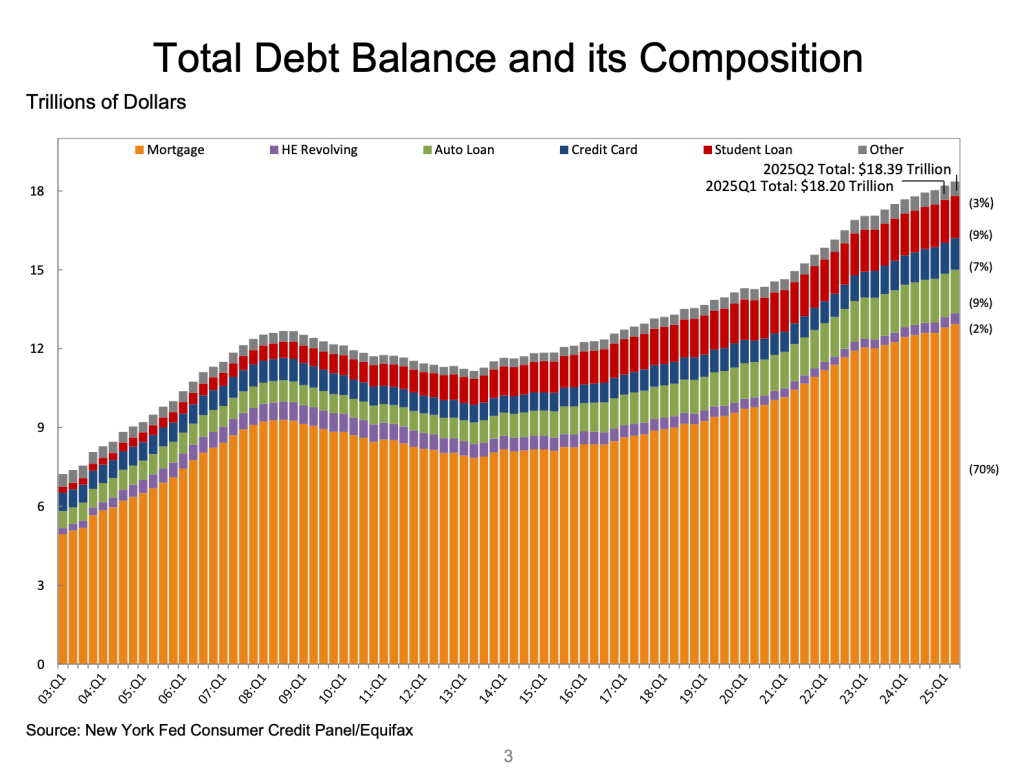
This 30% growth over approximately five years significantly outpaces inflation and wage growth during the same period, raising concerns about household financial stability.
The composition of this debt remains heavily weighted toward mortgages (70% of total debt at $12.94 trillion), followed by auto loans (9% at $1.66 trillion), student loans (9% at $1.64 trillion), and credit cards (7% at $1.21 trillion)
While Credit Cards makes up only 7% of this mix, the magnitude of liability it represents for an individual or household is far greater due to a higher levied APR associated with credit card balances.
From the perspective of a credit card company like Capital One, which relies on interest income from credit cards more than any other company, reported a 25% year on year increase in net revenue (yes, the financial results overall represent a $4.3 billion loss as well, driven by their acquisition of Discover, but that is a tale for another time).
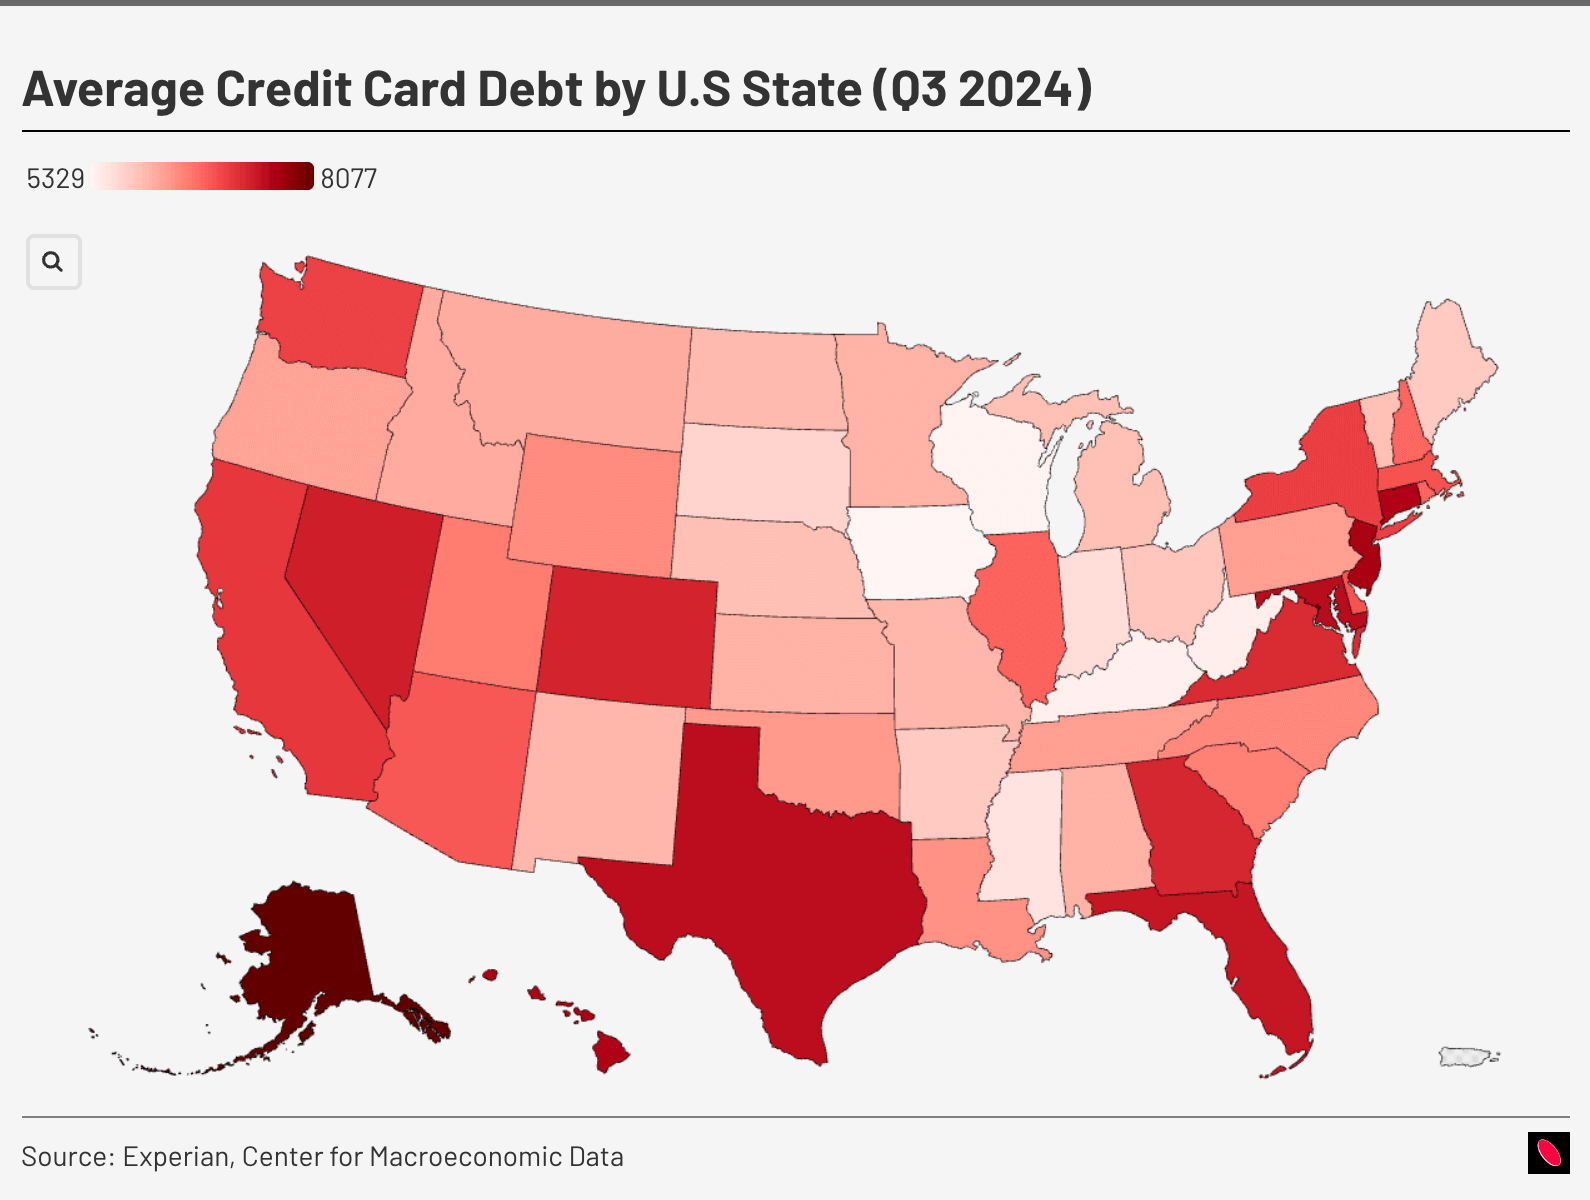
Average Credit Card Debt by State – Mapped
This is an interactive map. Tap or hover to reveal more information.
States with the darkest shading on the map—including Alaska, New Jersey, Connecticut, Maryland, Hawaii, Nevada, Colorado, Texas, Florida, and notably Georgia—show average credit card debts approaching or exceeding $8,000. These states share several common characteristics:
| Characteristic | States/Areas | Reason for High Credit Card Debt |
| High Cost of Living | Hawaii, Alaska, New Jersey, Connecticut | Higher daily expenses lead to increased credit card usage for routine purchases. |
| Urban Consuption | Texas (Houston/Dallas/Austin), Florida (Miami/Orlando), Georgia (Atlanta) | Urban consumption patterns and lifestyle costs contribute to higher debt levels. |
| Tourism and Service Economies | Nevada, Hawaii, Florida | Income volatility in these sectors can drive credit card dependency during lean periods. |
Read more:
Low-Debt States
The lightest-colored states, showing average credit card debts in the $5,300-$6,000 range, cluster primarily in the Midwest and include states like Iowa, Wisconsin, Kentucky, and West Virginia. These states typically feature:
- Lower costs of living – low cost of living = less expenses, more savings, and less debt in the long term.
- ‘A paycheck goes further’ mentality – For example, in Kansas City, Missouri, residents keep 39% of their median income compared to higher percentages in more expensive cities
- Smaller urban centers with less consumption pressure (relative to say New York City, Miami, or LA)
- Traditional manufacturing and agricultural economies
California
Interestingly, California shows moderate credit card debt levels despite having some of the highest costs of living in the nation. This apparent contradiction likely reflects the state’s income inequality—while many struggle with debt, the presence of high-earning tech workers and entertainment industry professionals may pull down the average.
Comparing Average Credit Card Debt with Median Personal Income
If we were to compare the average credit card debt with median individual income for each state, the results show that some southern states carry higher credit card debt as a percentage of the median personal income in their respective states
This is an interactive map. Please tap or hover to reveal more information.
Florida stands out of all states, showing the average credit card debt making up a whopping 20.38% of the median personal income, followed by Texas at 19.34%, Georgia at 19.24%, Nevada at 18.94%, and Alaska at 18.75%.
Impact of Interest Rates on Credit Card Debt
The Federal Reserve’s campaign to combat inflation through a series of interest rate hikes has had a direct and punishing effect on holders of credit card debt.
When the Fed raised its benchmark federal funds rate, credit card issuers almost immediately pass those higher borrowing costs on to their customers in the form of higher Annual Percentage Rates (APRs).

As a result, the average APR on credit card accounts accruing interest has surged to 22.25% as of the Q2 of 2025 according to Lending Tree, with rates on new offers climbing even higher to 24.36%
Age Demographics
To gain a deeper understanding of credit card debt, perhaps it is worth contextualizing it with other debt types and by age demographics.
This is an interactive chart. Tap or hover to reveal more information.
The 18-29 age group shows the smallest total debt burden but the highest proportion of student loans relative to their total debt. With limited mortgage exposure and moderate credit card usage, this group’s credit card debt exposure remains the lowest compared to other age groups.
The 30-39 and 40-49 age groups carry the heaviest debt burdens, dominated by mortgages. This reflects typical lifecycle patterns of home buying, family formation, and peak consumption years.
The 40-49 group shows the highest absolute debt levels, with mortgages comprising approximately 75% of their total debt burden.
Notice the continuous increase in credit card debt from the 18-29 to 40-49, with the latter representing the largest exposure to this debt class out of all age groups.
The 50-59 group maintains substantial mortgage debt while beginning to reduce other forms of borrowing, including credit card debt. The presence of HELOC debt becomes more prominent, possibly reflecting home equity extraction for college expenses or retirement preparation.
Both 60-69 and 70+ age groups show dramatic reductions in total and credit card debt, with mortgages still dominating but at much lower absolute levels. The minimal presence of student loans and reduced credit card balances suggest successful deleveraging strategies or fixed-income constraints.
This is just one side of the coin, as you will see in the next section
Transition rate into Serious Delinquency
The most telling data is not the static delinquency rate but the flow of consumers falling behind for the first time.
The transition rate into serious delinquency (defined as 90 or more days past due) for credit cards stood at 6.93% in the second quarter of 2025.
While this rate is slightly down from the previous year’s 7.18%, it remains significantly elevated compared to the post-pandemic period.
Age Demographics and Serious Delinquency
The age-specific data from the New York Fed report is particularly alarming. The chart tracking “Transition into Serious Delinquency (90+) for Credit Cards by Age” shows a stark generational divide.
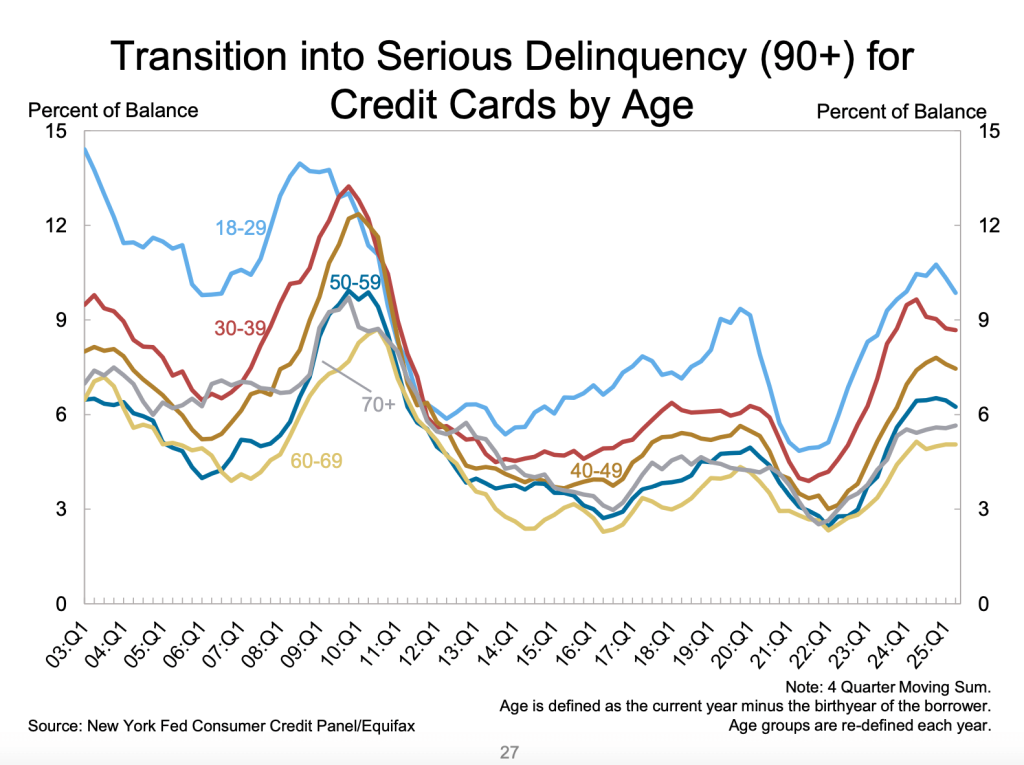
Younger borrowers, specifically those in the 18-29 and 30-39 age brackets, are falling seriously behind on their credit card payments at rates that far exceed those of older generations.
This trend also reveals a two-tiered financial system emerging in the United States. While homeowners, who are typically older, have remained relatively stable (mortgage delinquency rates are low and rising only slightly), those who rely on non-housing debt, such as credit cards and auto loans, are showing significant signs of strain.
A key factor in this divergence is access to assets. Homeowners can often tap into their home equity through vehicles like Home Equity Lines of Credit (HELOCs), which have seen balances rise for 13 consecutive quarters.
This provides a financial backstop that can be used to cure other delinquencies. Renters and younger consumers, who lack this asset, have no such cushion.
Credit card delinquency, therefore, is becoming a primary symptom of this growing divergence in financial stability based on asset ownership.
Final Thoughts
Looking ahead to the remainder of 2025 and into 2026, the economic environment is expected to remain challenging for many households, which ultimately will impact the ability to pay down their credit card debt.
After a period of surprising resilience, consumer spending is forecast to cool significantly. Morgan Stanley Research projects that year-over-year growth in nominal spending will slow from 5.7% in 2024 to 3.7% in 2025.
This slowdown is expected to be most pronounced among lower and middle-income consumers, who are more vulnerable to the effects of a cooling labor market and potential price increases from tariff-induced inflation.
While the Federal Reserve has begun to cut its benchmark interest rate, consumers carrying credit card balances should not expect immediate relief.
Bankrate predicts that credit card APRs will remain elevated for the foreseeable future, as they do not move in lockstep with Fed rate changes and issuers are often slower to lower rates than they are to raise them.
This means the cost of carrying debt will continue to be a significant headwind for households trying to pay down their balances.
Leave a Reply