
To join the ranks of the top 1% of earners in the United States, a household needed an average annual income of $664,502 in 2025.
This figure, while stratospheric, represents a notable 8% decrease from the 2024 peak, a shift largely attributed to easing inflation.
The gap between the highest and lowest thresholds is a staggering 2.5x, with Connecticut requiring an income of $1,056,996 to be in the top 1%, while West Virginia’s threshold is just $416,310 .
While income requirements fell in 47 states, three outliers—North Dakota, Florida, and Oklahoma—saw their thresholds increase, signaling unique local economic dynamics.
From a fiscal standpoint, the wealthiest 1% of taxpayers, who account for 22.4% of the total Adjusted Gross Income (AGI) in the nation, contributed 40.4% of all federal income taxes.
A Quick Note on Our Methodology
For the purpose of this analysis, we used the SOI Tax Stats by state published by the IRS for the year 2022, and extrapolated the numbers using Inflation, consumer prices, reported by the Federal Reserve, since numbers for 2025 were not available at the time of writing.
Top 1% vs. 5% and Median Income
The income required to be in the top 1% is almost nine times the national median household income, representing a considerable gap between the highest earners and the typical American household.
Even reaching the top 5% requires an income of $290,185, less than half the amount needed for the top 1%.
| Income Percentile | 2025 Threshold (National) | Multiple of Median Household Income |
|---|---|---|
| Top 1% | $731,492 | 8.7x |
| Top 5% | $290,185 | 3.5x |
| Median | $83,730 | 1.0x |
Top 10 States with Highest Thresholds
A handful of states, concentrated in the Northeast and on the West Coast, require incomes approaching or exceeding one million dollars to enter the top 1%.
Connecticut leads all states, followed by Massachusetts and California.
| Rank | State | Household Income floor for top 1% of earners |
| 1 | Connecticut | $1,056,996 |
| 2 | Massachusetts | $965,170 |
| 3 | California | $905,396 |
| 4 | New Jersey | $901,082 |
| 5 | New York | $891,640 |
| 6 | Florida | $859,381 |
| 7 | Washington | $819,101 |
| 8 | Colorado | $772,989 |
| 9 | Wyoming | $771,369 |
| 10 | Texas | $743,955 |
The District of Columbia, while not a state, has the highest threshold of any jurisdiction in our analysis at $1,250,029.
Top 10 States with Lowest Thresholds
Conversely, states primarily in the South and Appalachia have the lowest income requirements to be considered a top earner.
West Virginia has the lowest threshold in the nation, requiring less than half the income needed in Connecticut.
| State | Household Income floor for top 1% of earners |
| West Virginia | $416,310 |
| Mississippi | $439,479 |
| New Mexico | $451,639 |
| Kentucky | $496,281 |
| Arkansas | $517,761 |
| Indiana | $531,332 |
| Alabama | $532,600 |
| Oklahoma | $544,679 |
| Ohio | $550,724 |
| Maine | $550,936 |
Why the Gap?
There are several reasons that can be attributed to the differences in thresholds.
Perhaps the first thing that comes to mind is the differences in cost of living as well as salaries, which are tied to every location.
In this section we will consider three different factors contributing to the gap.
Progressive Tax Structures
States with highly progressive income tax systems and high top marginal rates can influence both nominal income levels and migration patterns of high earners.
California, for example, has the nation’s highest top marginal income tax rate at 13.3% and a highly progressive structure.
On the other hand, states like Texas and Florida have no state income tax, creating a powerful financial incentive for high earners to relocate, which in turn affects the composition of the top 1% in both the origin and destination states.
| States with No Income Tax | States with a Flat Income Tax | States with a Graduated-Rate Income Tax |
|---|---|---|
| Alaska, Florida, Nevada, New Hampshire, South Dakota, Tennessee, Texas, and Wyoming | Arizona, Colorado, Georgia, Idaho, Illinois, Indiana, Iowa, Kentucky, Louisiana, Michigan, Mississippi, North Carolina, Pennsylvania, Utah, Washington* | Alabama, Arkansas, California, Connecticut, Delaware, Hawaii, Kansas, Maine, Maryland, Massachusetts, Minnesota, Missouri, Montana, Nebraska, New Jersey, New Mexico, New York, North Dakota, Ohio, Oklahoma, Oregon, Rhode Island, South Carolina, Vermont, Virginia, West Virginia, Wisconsin, Washington DC |
Location of High Wage Industries
The concentration of high-wage industries delivers tailwinds to the top-income thresholds.
States with a large presence in finance, technology, and professional services have a larger pool of high earners, which naturally elevates the bar for entering the top percentile.
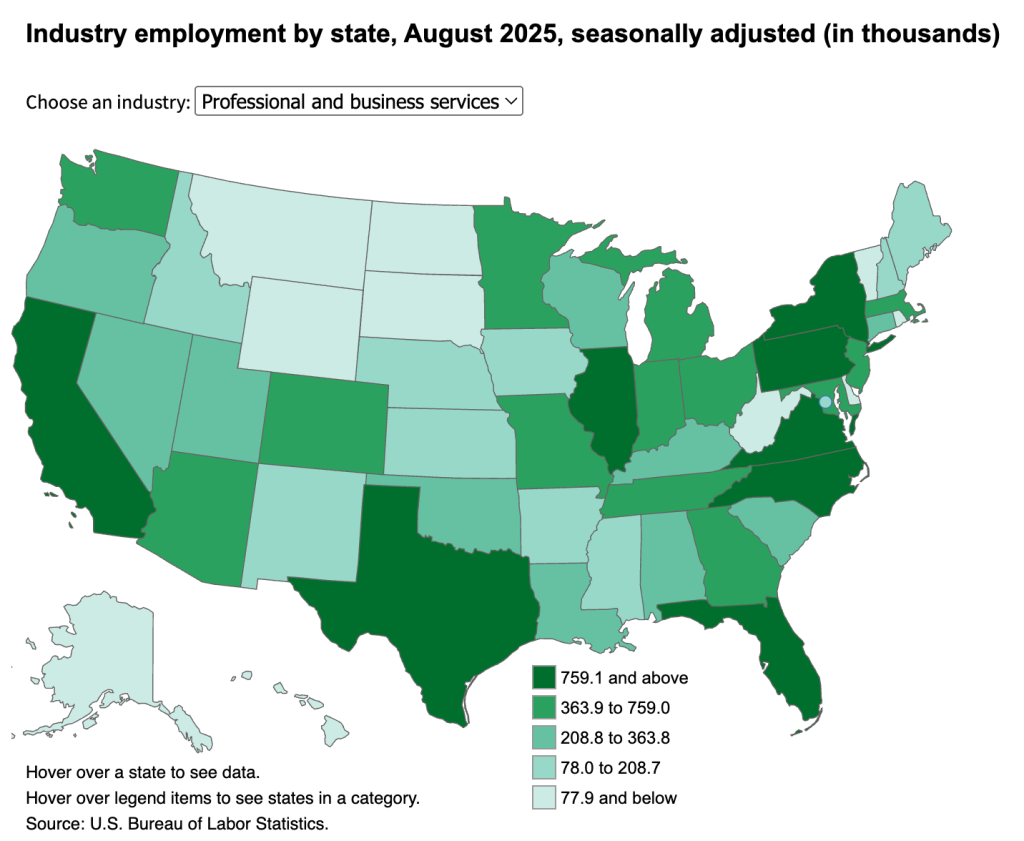
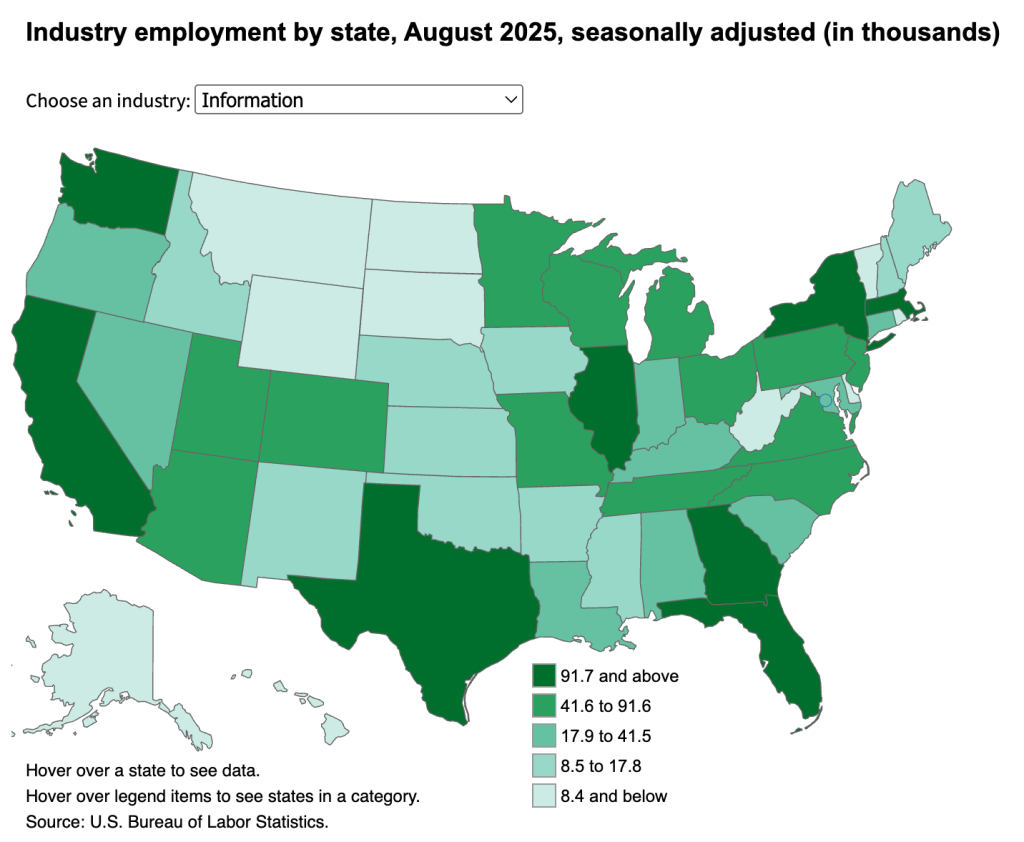
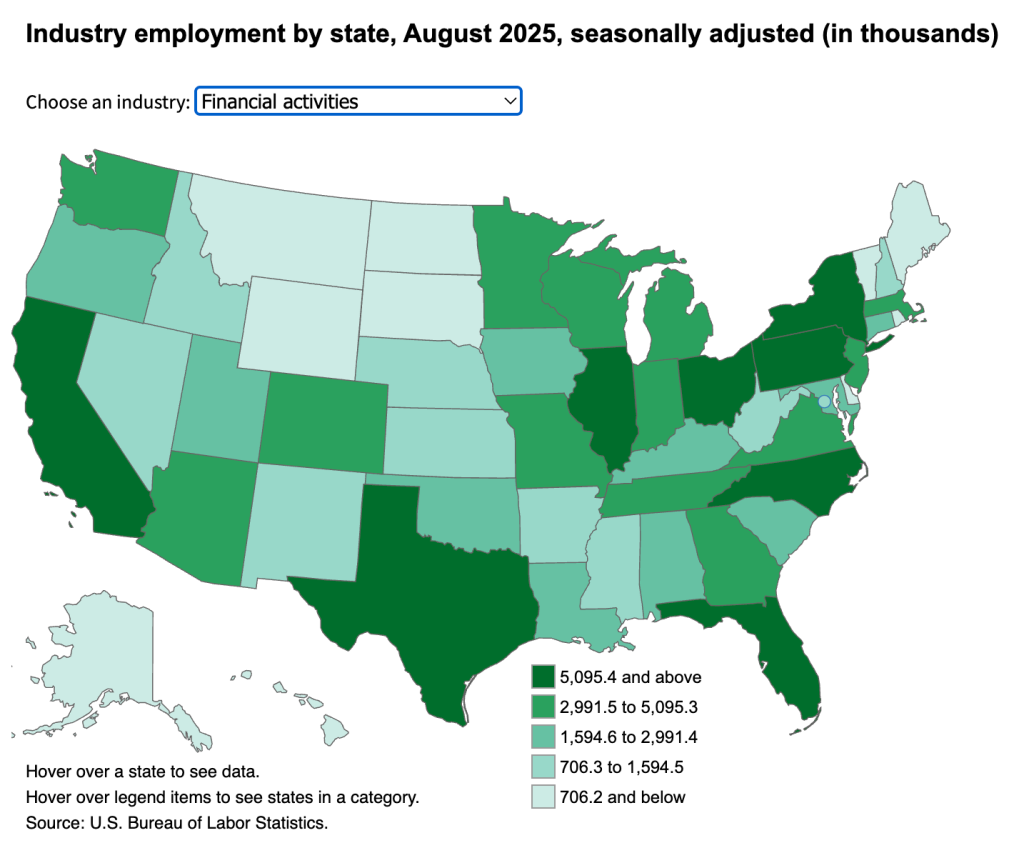
Image credits: Bureau of Labor Statistics
Take the example of Connecticut, having proximity to New York City’s financial sector and the District of Columbia’s ecosystem of high-paying government and contracting jobs, which contributes to their 1% income floors.
High Cost of High Earnings
States with a high cost of living, as measured by indices like the Bureau of Economic Analysis’s Regional Price Parities (RPP), consistently demand higher nominal incomes to join the top 1%.
A higher income is needed simply to afford a comparable standard of living.
This is evident in states like Connecticut, Massachusetts, and California, which have both high costs of living and high income thresholds.
Income Composition of the 1%
The nature of income for top earners has shifted dramatically over the past few decades.
While wages remain a component, pass-through business income—profits from S-corporations, partnerships, and sole proprietorships—has become a dominant source.
This category grew from representing just 11% of top 1% income in 1980 to 36% by 2019.
This shift has two major implications. First, this income source is more volatile than traditional wages, as it is tied directly to business performance and economic cycles.
This volatility can contribute to the significant year-over-year fluctuations observed in state-level top 1% income thresholds.
Second, pass-through income has limited third-party information reporting, which can lead to higher rates of under-reporting compared to wages, posing a challenge for tax enforcement.
Appendix
Top 1% and Top 5% Income Thresholds by State (2025)
| Rank | State | Number of top 1% returns | Income floor for top 1% of earners | Income floor for top 5% of earners |
| 1 | Connecticut | 16,917 | $1,056,996 | $362,263 |
| 2 | Massachusetts | 32,795 | $965,170 | $378,434 |
| 3 | California | 175,045 | $905,396 | $353,073 |
| 4 | New Jersey | 43,042 | $901,082 | $367,108 |
| 5 | New York | 91,840 | $891,640 | $307,753 |
| 6 | Florida | 105,101 | $859,381 | $281,811 |
| 7 | Washington | 35,597 | $819,101 | $355,767 |
| 8 | Colorado | 27,685 | $772,989 | $318,659 |
| 9 | Wyoming | 2,611 | $771,369 | $255,320 |
| 10 | Texas | 128,130 | $743,955 | $284,661 |
| 11 | New Hampshire | 6,796 | $735,374 | $311,145 |
| 12 | Illinois | 56,794 | $731,202 | $292,729 |
| 13 | Nevada | 14,754 | $703,713 | $248,739 |
| 14 | Virginia | 39,103 | $701,792 | $314,694 |
| 15 | North Dakota | 3,431 | $695,759 | $272,755 |
| 16 | Utah | 13,991 | $690,548 | $270,645 |
| 17 | South Dakota | 4,062 | $687,190 | $255,851 |
| 18 | Maryland | 29,040 | $677,543 | $304,250 |
| 19 | Minnesota | 26,423 | $671,408 | $285,607 |
| 20 | Georgia | 46,220 | $662,821 | $267,958 |
| 21 | Montana | 5,101 | $656,830 | $251,774 |
| 22 | Pennsylvania | 58,541 | $655,636 | $272,141 |
| 23 | Arizona | 31,872 | $641,262 | $261,362 |
| 24 | North Carolina | 46,525 | $640,783 | $268,730 |
| 25 | Tennessee | 30,531 | $638,299 | $247,765 |
| 26 | Idaho | 8,145 | $627,839 | $249,451 |
| 27 | Kansas | 12,643 | $609,946 | $253,834 |
| 28 | Nebraska | 8,660 | $603,899 | $251,139 |
| 29 | Rhode Island | 5,224 | $603,162 | $258,276 |
| 30 | Oregon | 19,053 | $603,006 | $270,877 |
| 31 | Alaska | 3,223 | $586,381 | $266,499 |
| 32 | Vermont | 3,123 | $583,559 | $249,931 |
| 33 | South Carolina | 23,203 | $580,600 | $241,531 |
| 34 | Delaware | 4,726 | $578,580 | $260,787 |
| 35 | Wisconsin | 27,293 | $566,711 | $242,066 |
| 36 | Michigan | 45,218 | $561,582 | $241,403 |
| 37 | Hawaii | 6,472 | $561,147 | $249,850 |
| 38 | Missouri | 26,898 | $559,043 | $237,461 |
| 39 | Iowa | 13,821 | $554,046 | $241,591 |
| 40 | Louisiana | 18,593 | $551,125 | $225,674 |
| 41 | Maine | 6,618 | $550,936 | $236,338 |
| 42 | Ohio | 53,103 | $550,724 | $232,196 |
| 43 | Oklahoma | 16,106 | $544,679 | $224,074 |
| 44 | Alabama | 20,185 | $532,600 | $226,634 |
| 45 | Indiana | 30,120 | $531,332 | $227,098 |
| 46 | Arkansas | 12,198 | $517,761 | $217,087 |
| 47 | Kentucky | 18,395 | $496,281 | $215,196 |
| 48 | New Mexico | 9,310 | $451,639 | $211,101 |
| 49 | Mississippi | 11,731 | $439,479 | $195,171 |
| 50 | West Virginia | 7,316 | $416,310 | $196,335 |
Sources: Internal Revenue Service, and Federal Reserve.
Leave a Reply