On September 19, 2025, President Donald Trump issued an executive order placing a “restriction on entry” and a $100,000 fee on H1B non-immigrant visa.
The purpose of this article is not to deliver an opinion on the executive order, but rather to show data on how many approved beneficiaries the H1B visa has had in 2025, their distribution by state, the top employers who petitioned for the most number of H1Bs, and more.
Before we get into the article, a quick shoutout to our sponsor – Hiring.Garden

Are you looking for jobs that sponsor visas in the U.S?
Then, you must check out Hiring.Garden.
Explore thousands of jobs that sponsor, including H1-B cap exempt jobs, and new grad roles.
Now, back to the article.
The H1B
According to the renowned theoretical physicist Dr. Michio Kaku, the H1B visa is “America’s secret weapon” and the “Genius Visa.”
He views it as the single most important factor sustaining the scientific and technological dominance of the United States
Dr. Kaku argues that the American education system is one of the worst among developed nations, yet the U.S. continues to lead in innovation and scientific breakthroughs.
He resolves this paradox by pointing to the H1B visa, which he describes as a magnet that sucks up the most brilliant minds from around the world.
Number of H1B petitions by company
Number of approved H1B petitions as a percentage of a company’s total U.S based workforce
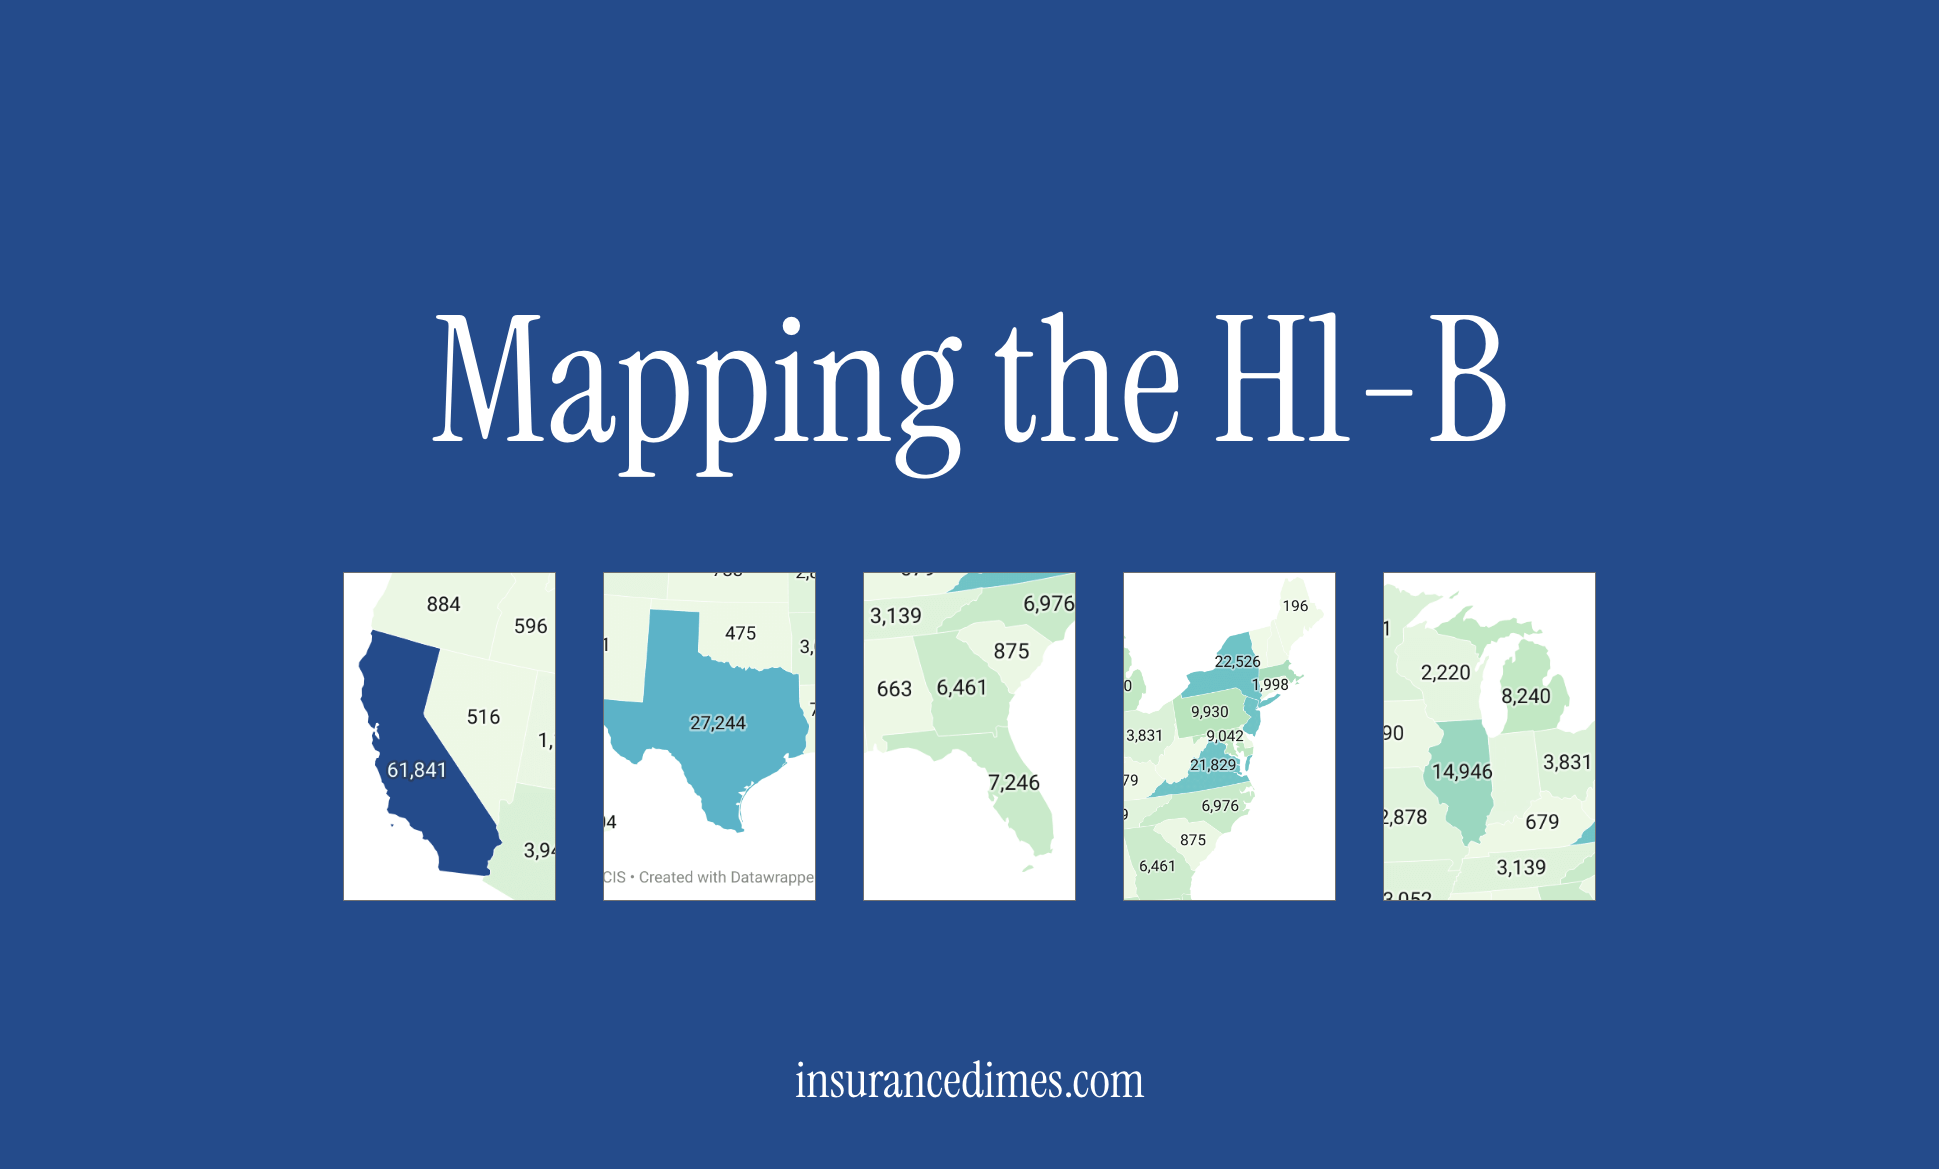
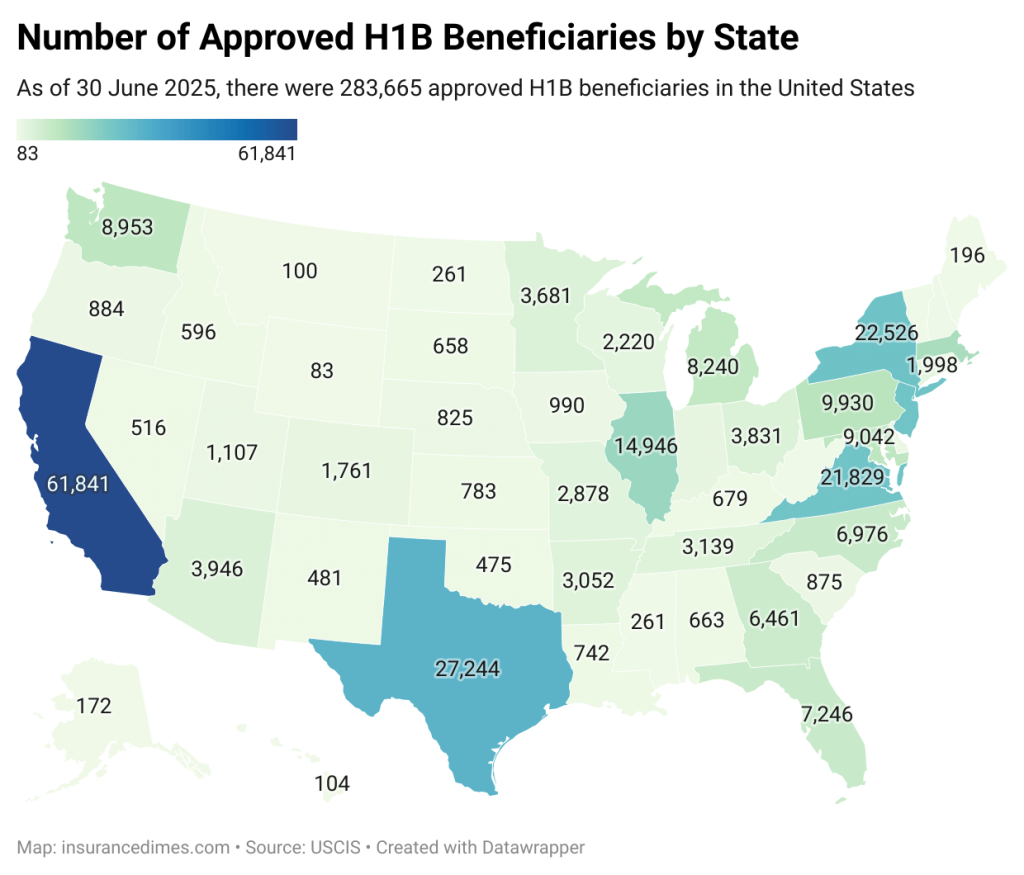
Map of approved H1B beneficiaries by state
This map shows the total number of approved H1B beneficiaries by state.
Note: This is not the same as an active H1B holder since an approved beneficiary might still decline a role and not choose to work for the petitioning employer, though this is relatively rare.
As Dr. Kaku emphatically states that without the H1B visa, “there would be no Silicon Valley.” He points out that a significant percentage of individuals in high-tech hubs are foreign-born.
This can be explicitly noticed by California having the highest number of approved H1B beneficiaries in the United States.
Other states with a high number of approvals include Texas, New York, Virginia, and New Jersey.
These states are home to major centers for technology, healthcare, and finance, where there is a high demand for specialized foreign talent.
States with smaller labor markets or fewer large employers tend to have significantly fewer H1B approvals.
States like Montana, Wyoming, and Alaska are at the lower end of the spectrum.
Employers with the highest number of H1-B approvals
According to the United States Citizenship and Immigration Services (short for USCIS), in 2025, a total of 52,000 U.S companies submitted H1-B visa registrations for 442,000 unique beneficiaries.
Out of the 442,000 unique beneficiaries, 283,665 received approvals.
The top 100 companies by approved H1-B beneficiaries received a total of 106,156 approvals, representing 37% of the total approved.
The map below visualizes the company-by-company breakdown of the approved beneficiaries for the top 100 companies with the most approvals.
Key Insights
Major tech companies and IT consulting firms continue to be the biggest users of the H-1B visa program.
Firms like Amazon, Microsoft, Meta Platforms, Apple, and Google secured thousands of approvals, reflecting their ongoing demand for highly skilled foreign talent in specialized fields such as software development, cloud computing, and AI.
Similarly, Indian IT services giants like Tata Consultancy Services and Cognizant were among the top petitioners, indicating their reliance on H-1B visas to staff projects for their U.S.-based clients and operations.
Due to their increased exposure to the newly enacted executive order, Tech companies ordered their employees on the H1-B to avoid foreign travel.
It remains the single most affected industry with 65% of all active H1-B holders working in a computer related field.
H1-B beneficiaries as a percentage of U.S-based employees
If we were to map out the magnitude of the impact the executive order has on individual companies, we can observe that overall, the number of approved beneficiaries make up 2.41% of the total U.S based employees for this particular selection of companies.
Additional companies were not added to the list above since a majority of companies do not disclose their specific geographical breakdown of employee headcount, and rather report total global numbers, and hence were not included in the list.
A more accurate measure would be to find the number of H1-B beneficiaries by profession as a percentage of the total number of U.S based employees within the company in that profession.
Naturally, such information is not publicly available, which is why a general perspective was formed in this article.
In terms of the data, it is crucial to understand that this data shows proportional dependency, not the total volume of H1-B employees. The data only represents total approvals for 2025.
Consider the case of a company like Amazon, despite its low percentage (0.91%), it is consistently one of the largest sponsors of H1-B visas in absolute numbers.
Its percentage is heavily diluted by its massive U.S. workforce of over one million employees in fulfillment and delivery operations.
Conversely, a smaller tech company might have a higher percentage but fewer H1-B employees overall.
Downloadable Maps used in this article
Leave a Reply