In the 2024 to 2025 academic year, the average full time faculty salary hit $105,657, the second year in a row it crossed six figures.
Now forget that number. It hides almost everything interesting.
Underneath that tidy average is a system where your paycheck depends heavily on your school’s endowment, your subject, your state, your gender, and whether your institution was set up to fail from the start.
Here’s what the data actually shows once you stop looking at the average and start looking at the spread.
A handful of schools are dragging the average up
According to the latest data from the U.S Department of Education’s College Scorecard, Princeton pays its professors an average of $304,248 a year.
Stanford pays $302,376.
Harvard pays $300,576.
That’s roughly three times the national average, at three schools.
Most professors are nowhere near it.
Average Professor Salary by U.S. Institution
Top 20 institutions. Bar length reflects average yearly tenured faculty compensation relative to the highest reported figure. Figures are in USD.
- 1Princeton University$304,248
- 2Stanford University$302,376
- 3Harvard University$300,576
- 4Massachusetts Institute of Technology$290,124
- 5California Institute of Technology$287,916
- 6The Rockefeller University$274,500
- 7University of California-Los Angeles$274,176
- 8Yale University$271,080
- 9University of Pennsylvania$265,404
- 10Columbia University in the City of New York$258,192
- 11University of California-Berkeley$254,952
- 12Middle Tennessee School of Anesthesia Inc$252,276
- 13University of California-Santa Barbara$248,124
- 14Babson College$247,440
- 15Northwestern University$243,864
- 16Spertus College$242,004
- 17University of Chicago$237,672
- 18Dartmouth College$237,240
- 19Elmezzi Graduate School of Molecular Medicine$231,516
- 20University of California-Irvine$231,000
Source: College Scorecard, U.S. Department of Education. Bar length is scaled against the highest average salary in this dataset, Princeton University at $304,248.
Want to check your own school, or one you’re considering? There’s a searchable database further down.
The raise you got barely counted
Salaries rose 3.6% this year. Inflation ran about 2.6%. Do the subtraction and faculty gained roughly 1.0% in real purchasing power. Not nothing, but not much either.
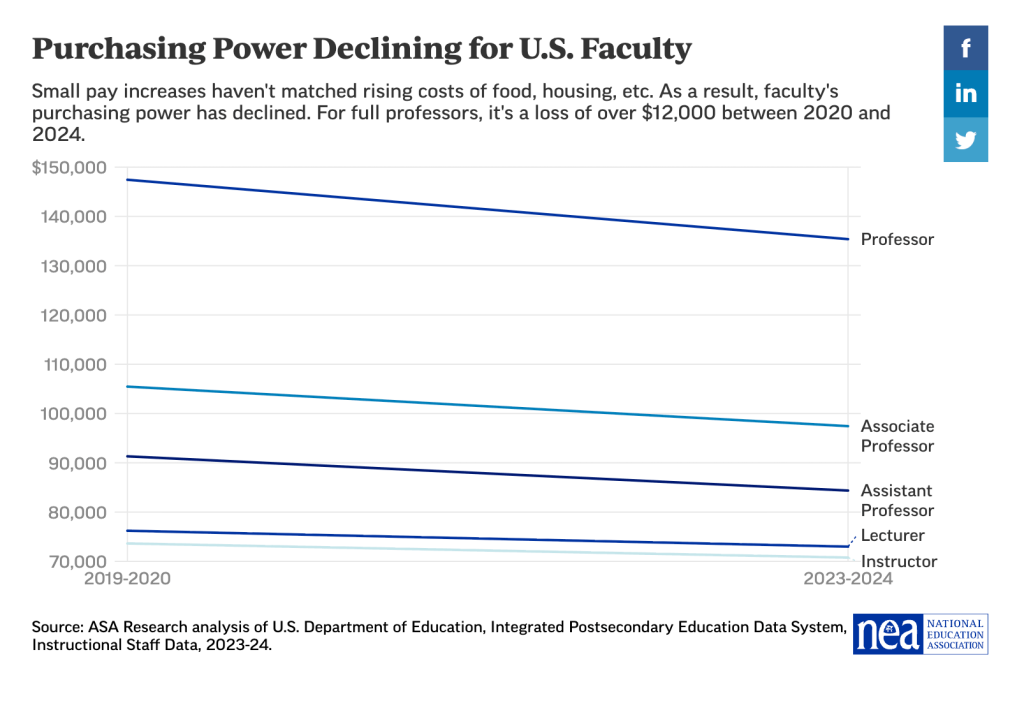
Adjusted for inflation, faculty pay in 2024 to 2025 still sits 5.9% below its pre pandemic high of $112,233 from 2019 to 2020. It’s also still below the pre Great Recession peak of $109,606 from 2008 to 2009.
Every rank took a hit. Full, associate, and assistant professors have all lost roughly 7% of their real purchasing power since their pre pandemic peak. Instructors are down about 5%, lecturers about 3%.
So the paycheck looks bigger than ever. What it actually buys hasn’t caught up.
What you teach matters more than where you teach
Pick health sciences and you’ll average $127,000. Pick library science and you’ll average $80,000. Same job title, same tenure track, wildly different outcomes.
Average Professor Salary by Field of Study
Average yearly faculty compensation across U.S. higher education institutions, grouped by subject taught. Figures are in USD.
Swipe to see all fields →
Source: National Center for Education Statistics. Bar height is scaled against the highest average salary in this dataset, Health at $127,000.
Health professors earn the most of any subject at four year universities, an average of $129,000.
At two year colleges, that same subject pays the least, just $81,000.
Meanwhile arts, communications, history, and humanities professors average $83,000 at two year colleges, making them one of the better paid groups there, but only $94,000 at four year schools, where they rank second from the bottom.
Same degree. Same discipline. Opposite position in the pay ladder depending on the type of school.
The more prestigious the school, the wider the gender gap
Nationally, women in higher ed earn 86% of what men earn.
That’s actually a bit better than the broader US labor market, where the figure is closer to 82%.
Women make up 49% of the academic workforce overall, and 54 to 57% of faculty at two year colleges.
But they’re only 36% of full professors at major research universities, which is exactly where the biggest paychecks live.
Gender Pay Gap in Professor Compensation by State
This map shows the average gender pay gap for college and university professors in each U.S. state. The percentage reflects how much less female professors earn on average compared to male professors in the same state. Hover or tap a state to see its exact figure. Darker colors indicate a larger gap.
Geography decides a huge chunk of your paycheck
At public four year universities, the national average sits at $107,874.
California tops the list at $143,417.
New Jersey is second at $135,787.
Average Salary at Public Four-Year Universities by State
This map shows the average salary reported at public four-year colleges and universities in each state. Hover or tap any state to see its exact figure. Darker shading represents a higher average salary.
View the full state by state data table
| State | Average Salary |
|---|---|
| Alabama | $95,008 |
| Alaska | $91,287 |
| Arizona | $107,231 |
| Arkansas | $77,848 |
| California | $143,417 |
| Colorado | $100,943 |
| Connecticut | $123,739 |
| Delaware | $127,037 |
| District of Columbia | $84,981 |
| Florida | $111,209 |
| Georgia | $97,435 |
| Hawaii | $123,929 |
| Idaho | $86,385 |
| Illinois | $110,096 |
| Indiana | $104,758 |
| Iowa | $109,620 |
| Kansas | $91,414 |
| Kentucky | $86,161 |
| Louisiana | $80,816 |
| Maine | $93,892 |
| Maryland | $120,334 |
| Massachusetts | $117,394 |
| Michigan | $115,767 |
| Minnesota | $108,503 |
| Mississippi | $80,596 |
| Missouri | $92,155 |
| Montana | $87,949 |
| Nebraska | $98,369 |
| Nevada | $117,188 |
| New Hampshire | $103,853 |
| New Jersey | $135,787 |
| New Mexico | $92,192 |
| New York | $106,112 |
| North Carolina | $101,771 |
| North Dakota | $88,999 |
| Ohio | $103,567 |
| Oklahoma | $87,987 |
| Oregon | $104,175 |
| Pennsylvania | $108,951 |
| Rhode Island | $108,626 |
| South Carolina | $97,905 |
| South Dakota | $87,149 |
| Tennessee | $95,128 |
| Texas | $103,484 |
| Utah | $98,950 |
| Vermont | $88,167 |
| Virginia | $116,939 |
| Washington | $114,558 |
| West Virginia | $82,245 |
| Wisconsin | $103,013 |
| Wyoming | $97,663 |
Source
Integrated Post Secondary Education Data System (IPEDS)
nces.ed.gov
Private four year schools pay more on average, $115,633 nationally.
New Jersey leads that list too, at $149,505, with Massachusetts close behind at $146,618.
Average Salary at Private Four-Year Universities by State
This map shows the average salary reported at private four-year colleges and universities in each state. Hover or tap any state to see its exact figure. Two states, Nevada and Wyoming, have no reported figure for this category. Darker shading represents a higher average salary.
View the full state by state data table
| State | Average Salary |
|---|---|
| Alabama | $71,292 |
| Alaska | $66,448 |
| Arizona | $89,484 |
| Arkansas | $66,344 |
| California | $139,686 |
| Colorado | $108,775 |
| Connecticut | $145,380 |
| Delaware | $117,396 |
| District of Columbia | $133,762 |
| Florida | $100,563 |
| Georgia | $97,760 |
| Hawaii | $82,494 |
| Idaho | $68,350 |
| Illinois | $122,919 |
| Indiana | $100,993 |
| Iowa | $73,110 |
| Kansas | $61,019 |
| Kentucky | $69,315 |
| Louisiana | $99,671 |
| Maine | $102,328 |
| Maryland | $127,395 |
| Massachusetts | $146,618 |
| Michigan | $78,077 |
| Minnesota | $87,751 |
| Mississippi | $65,891 |
| Missouri | $105,867 |
| Montana | $61,766 |
| Nebraska | $79,892 |
| Nevada | Not reported |
| New Hampshire | $138,416 |
| New Jersey | $149,505 |
| New Mexico | $88,651 |
| New York | $129,049 |
| North Carolina | $110,363 |
| North Dakota | $60,073 |
| Ohio | $84,589 |
| Oklahoma | $81,480 |
| Oregon | $90,557 |
| Pennsylvania | $114,341 |
| Rhode Island | $131,674 |
| South Carolina | $68,442 |
| South Dakota | $58,297 |
| Tennessee | $101,038 |
| Texas | $111,618 |
| Utah | $108,940 |
| Vermont | $100,011 |
| Virginia | $87,857 |
| Washington | $85,362 |
| West Virginia | $55,484 |
| Wisconsin | $82,144 |
| Wyoming | Not reported |
Source
Integrated Post Secondary Education Data System (IPEDS)
nces.ed.gov
A few state level details worth flagging. Nevada was the only state to raise public four year salaries by more than 10% in a single year, an 11.7% jump that moved it from 15th to 8th nationally, up to $117,188.
On the other end, Arkansas ($77,848), Mississippi ($80,596), and Louisiana ($80,816) sit at the bottom of the public four year rankings.
Their cost of living is also much lower, so the real gap in purchasing power is probably smaller than the raw numbers suggest.
So what's the real story
The headline number, that comfortable six figure average, is technically true and almost useless on its own.
The real story is a system stretched between a handful of schools paying near executive salaries and a much larger group of faculty who haven't recovered the purchasing power they had five years ago.
Your actual paycheck depends less on having a PhD and more on your subject, your state, your school's tax status, your gender, and whether your institution was ever funded the way it was legally supposed to be.
Leave a Reply